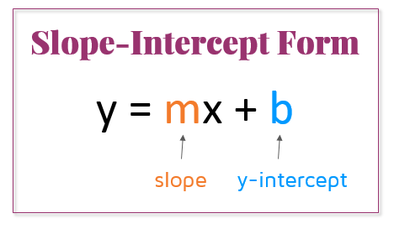
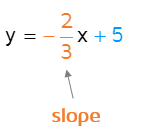
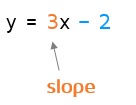
What is Slope-Intercept Form?If you're unfamiliar with the term, make sure to check out the intro lesson to slope-intercept form first. There are a few different ways to write the equation of a line. One of the most common ways is called "slope-intercept" form. It's called this because it clearly identifies the slope and the y-intercept in the equation. The slope is the number written before the x. The y-intercept is the constant written at the end.
The y-intercept is where the graph crosses the y-axis. Slope measures the steepness of a line. It's the ratio of the vertical change to horizontal change, or "rise over run." 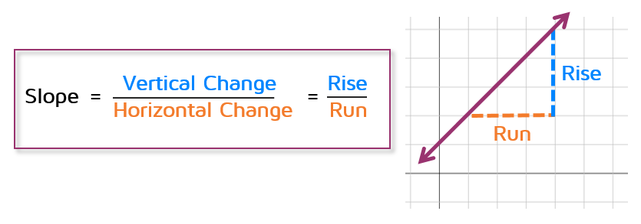
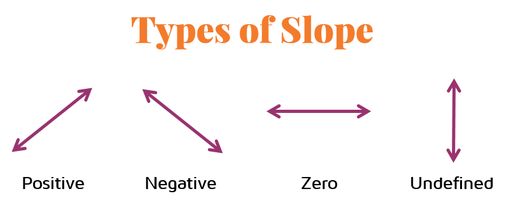
We can also tell the direction of the line from the slope. If the slope is positive, the line will go up to the right. If the slope is negative, it will go down to the right. Horizontal lines have a slope of 0 and vertical lines have an undefined slope.
|

|
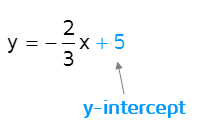
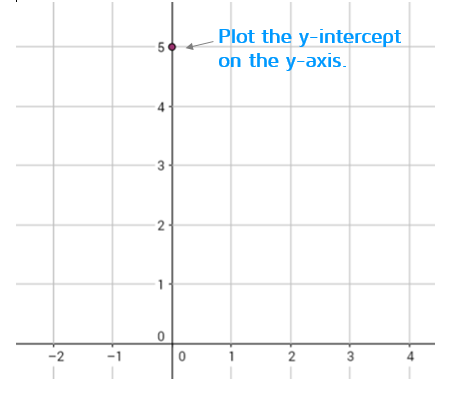
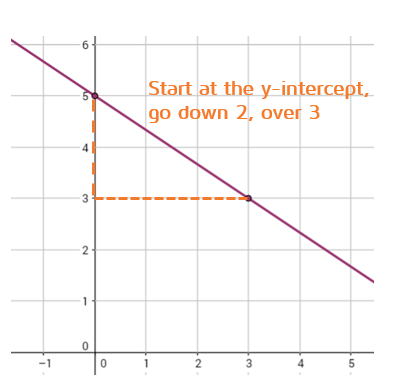
Step 1: Identify and plot the y-intercept. This equation has a positive 5 at the end, so the y-intercept is 5.
|
|
Step 2: Identify the slope and use it to plot a 2nd point on the graph. The number in front of the x is -2/3 so the slope is -2/3. The slope is negative, so the line will go down to the right. We can plot a 2nd point by starting at the y-intercept and going down 2 units, then over 3 units to the right. Connect the points with a straight line to finish the graph.
|
|
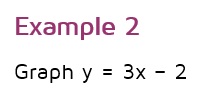
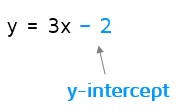
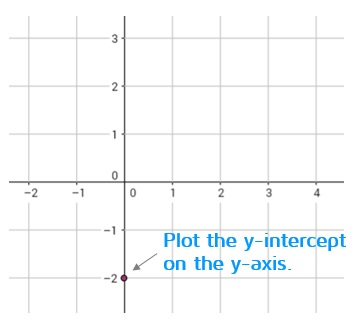
Step 1: Identify and plot the y-intercept. This equation has a minus 2 at the end, so the y-intercept is -2.
|
|
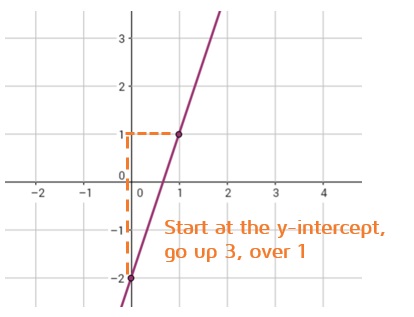
Step 2: Identify the slope and use it to plot a 2nd point on the graph. The number in front of the x is 3, so the slope is 3. We usually want slope to be a fraction so we can use rise/run to plot the 2nd point. We can rewrite 3 as 3/1 since dividing by 1 does not change a number. The slope is positive 3/1, so we can go up 3 units and over to the right 1 unit to plot the next point.
|
|
Video
Want to see another example? Check out the short video below.
Practice
Ready to try some examples on your own? Click the START button below to try a practice quiz.
|
Powered by Interact |