Introduction to Slope Math & Different Types of Slopes
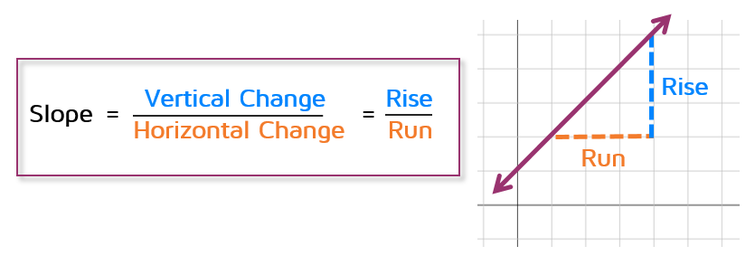
What is Slope?Slope measures the steepness of a line. The bigger the slope, the steeper the line is. The smaller the slope, the flatter it gets. Slope also tells us the direction of the line - if it goes up, down, or if it's horizontal or vertical.
Slope is calculated as the ratio of the amount of vertical change to horizontal change. The easiest way to remember this is that slope is equal to "Rise over Run." For example, if the slope of a line is 2/3, that means the line goes up 2 units for every 3 units to the right. Up 2, over 3.
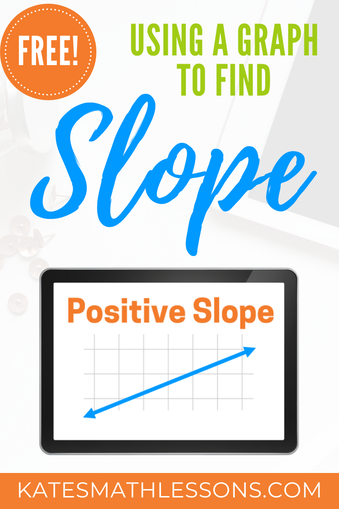
There are 4 different types of slope, depending on the direction of the line. If the line goes up to the right, the slope is positive. If the line goes down to the right, the slope is negative. A horizontal line has a slope of 0. A vertical line has an undefined slope. We'll look at each type in more detail next. 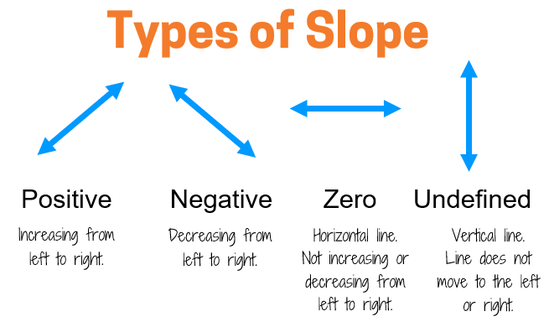
|
Welcome to Kate's Math Lessons!

|