|
Intro to Slope Page 2 of 4
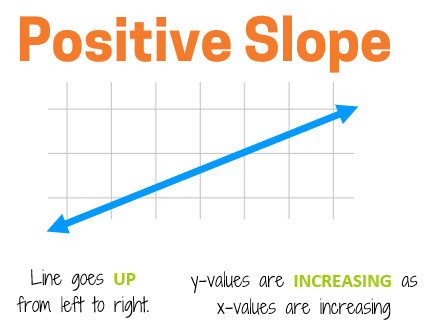
Positive SlopeIf the y-values are increasing as the x-values increase, the line has a positive slope. If you trace the line with your finger from left to right (the same order you read a book), the line will go up to the right.
Think of a situation that has a positive rate of change. Suppose you were adding $100 to your bank account each week (that's a positive change!). As time goes by, the amount of money you have in the account is increasing. If you graphed this situation, the line would go up to the right to show that the amount of money is increasing as time goes by. 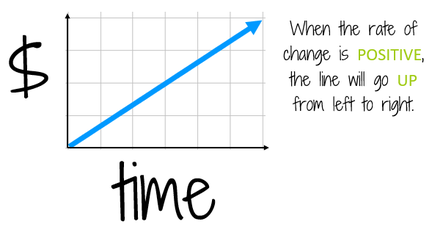
|
|
Negative Slope
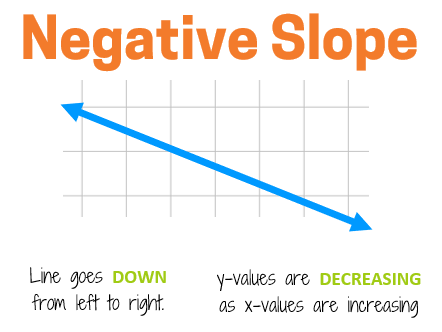
If the y-values are decreasing, the line has a negative slope. If you trace the line with your finger from left to right (the same direction that you read a book), the line will go down to the right.
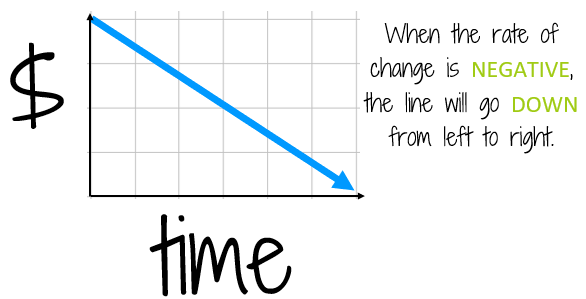
Think of a situation with a negative rate of change. Suppose instead of putting money into your bank account, you're spending $100 each week (this is a negative change!). If you graphed this, the line would go down to the right to show that the amount of money you have in your account is decreasing.
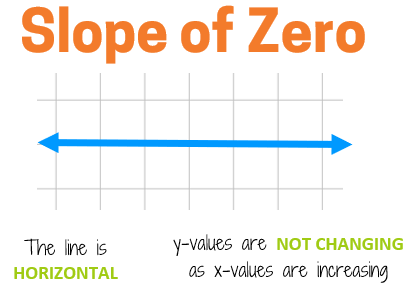
Slope of Zero
If the y-values are not changing as x increases, the line will have a slope of 0. Anytime the line is horizontal (flat from left to right), the slope is zero. This would indicate a situation where there isn't any change.
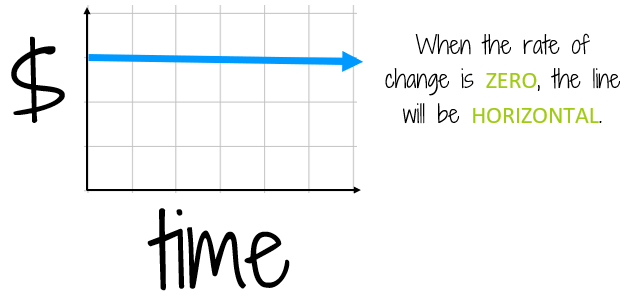
For example, if you just left your bank account alone and didn't put money in or take money out (and no interest was added). This is an example of a situation with a rate of change equal to zero, nothing is happening! To show that there is 0 amount of change, the graph would be a flat horizontal line. This shows that the amount of money isn't changing.
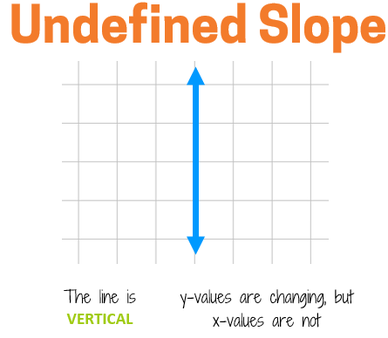
Undefined Slope
A vertical line has an undefined slope. In this situation, the y-values are changing, but the x-value always stays the same. If you look at the definition of slope, the amount of horizontal change is in the denominator of a fraction. In math, you can't have a 0 in the denominator. It doesn't make sense to divide by 0 so we say that the slope of a vertical line is undefined. There isn't a slope for these types of lines.
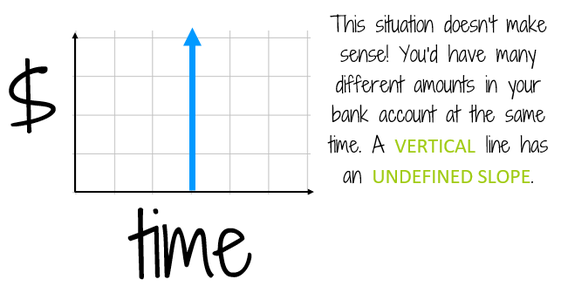
Think about the bank account example. It wouldn't make sense if the graph was a vertical line. That would you mean you had all sorts of different amounts in the bank at the same exact moment, which isn't possible.
|
|
|