What is an Inequality?An inequality is a way of saying that two things are not equal. The table below shows the different inequality symbols that can be used when two expressions are not equal to each other.

How Do You Graph an Inequality on a Number Line?Graphing x = a
Before we graph an inequality on a number line, let's look at how to graph an expression with an equals sign. If you had to graph x = 2, that means that x must be exactly equal to 2. It cannot be any other number except for 2. To graph this on a number line, you simply put a dot at 2 to show that there is only possible solution. 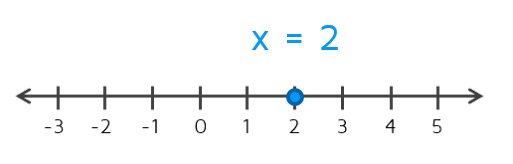
Graphing x > a Now let's look at what happens to the graph if we change it to x > 2. This means that x must be greater than or equal to 2. When x is just equal to 2, 2 is the only possible solution. When the symbol is changed to >, it now includes solutions that are larger than 2. To graph all of these possible solutions, we put a solid point at 2 (to show that 2 is included as a solution) and draw a ray towards all the numbers larger than 2 (to the right). 
|

|
The point is shaded in at 2 because 2 is included as one of the solutions. All of the numbers to the right of 2 on the number line are also included because they are greater than 2.
Graphing x > a
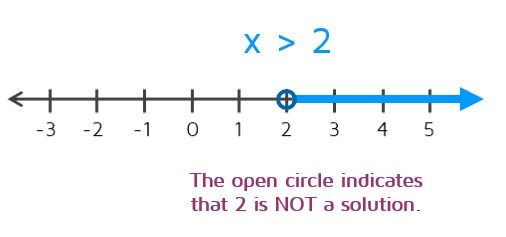
What happens if we remove the line under the inequality and change it to x > 2. This means x must be strictly greater than 2. Now 2 is no longer a solution because 2 is not greater than itself. But 2.1 is still a solution and so is 2.000001. How do you show that exactly 2 does not count but 2.000001 counts? You draw an open circle at 2. An open circle indicates that the number is not a solution. 2 does not count, but anything to the right of it on the number line is a solution.
What happens if we remove the line under the inequality and change it to x > 2. This means x must be strictly greater than 2. Now 2 is no longer a solution because 2 is not greater than itself. But 2.1 is still a solution and so is 2.000001. How do you show that exactly 2 does not count but 2.000001 counts? You draw an open circle at 2. An open circle indicates that the number is not a solution. 2 does not count, but anything to the right of it on the number line is a solution.
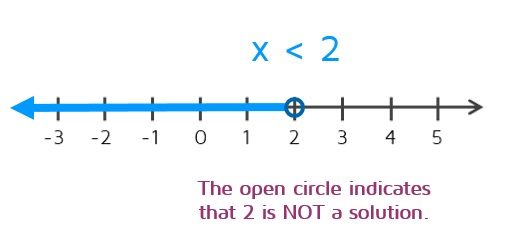
Graphing x < a
If we switch the sign around to x < 2, it becomes x is less than 2. We will still use an open circle to show that 2 is not a solution (2 is not less than itself). This time, we need to draw the ray to the left to indicate that all the numbers smaller than 2 are solutions to the inequality.
Graphing x < a
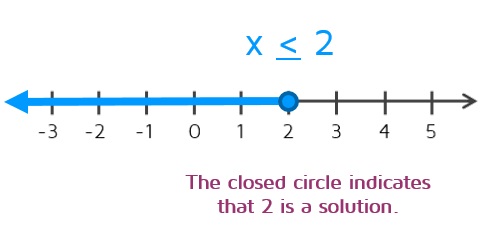
If we add the line back in under the inequality symbol, it becomes less than or equal to. To graph x < 2, we change the point to a solid circle to show that 2 is now included as a solution. Then draw a ray to the left to show that all the numbers 2 or less are solutions to the inequality.
If we add the line back in under the inequality symbol, it becomes less than or equal to. To graph x < 2, we change the point to a solid circle to show that 2 is now included as a solution. Then draw a ray to the left to show that all the numbers 2 or less are solutions to the inequality.
Practice
Ready to try a few problems on your own? Click the START button below to try a practice quiz.
|
Powered by Interact |
Want to learn how to solve an inequality?