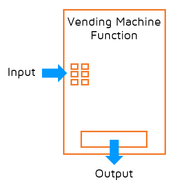
What's a Function?If you checked out the Intro to Functions lesson, you may remember that a function takes an input value and assigns an output value.
Representing Functions with MappingsOne important rule to remember about a function is that it can only assign ONE output value to an input value. The set of all input values is called the domain and the set of all output values is called the range.
There are several different ways to represent a function. One way is to use a mapping diagram. A mapping diagram uses arrows to show which input and output values are paired up.
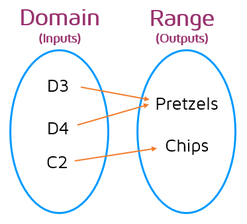
In this example, the arrows tell you what you'll get when you enter a code into the vending machine. There are two slots right next to each other that hold pretzels, so you can enter the code D3 or D4 to get a bag of pretzels. If you enter the code C2, you'll get a bag of chips. Remember, a function can only assign one output value to an input value. Here's an example of a mapping that does NOT represent a function: |

|

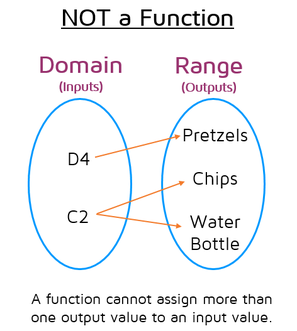
According to the mapping diagram above, if you entered the code C2 in the vending machine, it might drop either a bag of chips OR a water bottle. There's something wrong with this machine! In order to be a function, each input value can only be assigned to ONE output value. If you enter the code C2 and get a bag of chips, you should get a bag of chips the next time you enter C2. If you enter the same input value again later, you should get the same exact output value that you got the last time.
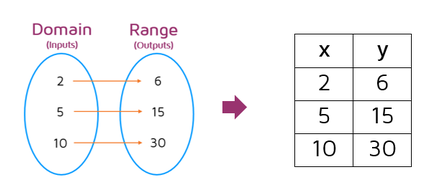
Let's look at a mapping diagram that uses numbers. Let's say our function takes an input value and multiplies it by 3. We could enter a few different numbers as input values and make a mapping diagram to show the corresponding output values.
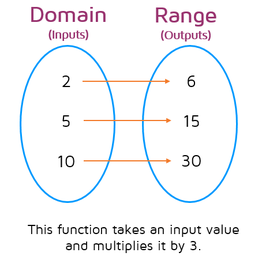
This mapping diagram shows that if you enter the number 2, the function multiples it by 3 and gives 6 as the output value. If you enter 5, you get 15 out. If you enter in 10, you get 30 as the output value.
Representing Functions with Tables
You can also use tables to represent functions. Instead of using two ovals with circles, a table organizes the input and output values with columns. The input/domain values go first on the left as the x-values and the corresponding output/range values are listed second in the next column as the y-values.
Remember, a function can only assign an input value to one output value. If you see the same x-value with more than one y-value, the table does not represent a function.
Representing Functions with Ordered Pairs
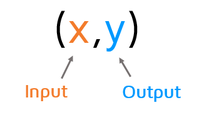
Another option is to represent a function by writing it as a set of ordered pairs. The input/domain values are always listed first in the ordered pair as the x-values and the output/range values are always listed second in the ordered pair as the y-values.
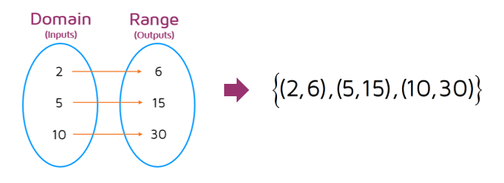
We can use the same mapping diagram from earlier to represent the function with ordered pairs instead. The function can be written as a set of ordered pairs (notice the curly set brackets on the outside). Make sure to put the input values first as the x-coordinates and the corresponding output values second as the y-coordinates.
We can use the same mapping diagram from earlier to represent the function with ordered pairs instead. The function can be written as a set of ordered pairs (notice the curly set brackets on the outside). Make sure to put the input values first as the x-coordinates and the corresponding output values second as the y-coordinates.
Remember, a function can only assign an input value to one output value. If you see an x-value repeated in the set and it's been matched with a different y-value, it's not a function.
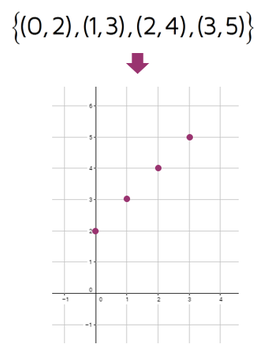
Representing Functions with Graphs
One additional way to represent a function is with a graph. If you have a function that's represented as a set of ordered pairs, you can plot each ordered pair and use the graph to represent the function.
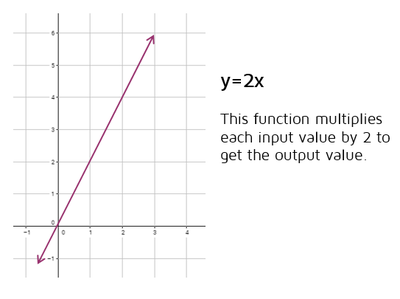
On a graph, a function could be just a set of ordered pairs or it can also be represented as a continuous line. For example, the line y = 2x is a function, it takes an input value and multiplies it by 2 to get the output value. The graph of a function doesn't have to be a straight line, a function can also be a curve.
Video
Want to see some more examples? Check out the short video on functions below.
Practice
|
Can you answer some questions about functions on your own? Click the START button below to try a practice quiz.
Powered by Interact |
Want to learn more about functions? Make sure to check out the lessons on function notation and the Vertical Line Test.