|
Intro to Functions Page 2 of 3
Mapping DiagramsFunctions are often represented in math by drawing mapping diagrams. The input values are written in an oval on the left side and the output values are written in an oval on the right side. Arrows are drawn to show which input and output values go together.
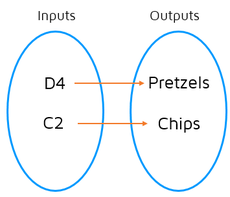
D4 and C2 are the input codes you enter into the vending machine function. The outputs are what comes out after you enter the code. When you draw a mapping diagram, you draw an arrow from the input value on the left to the corresponding output value on the right. Let's say there are two slots right next to each other in the vending machine that both hold pretzels. You can choose either D3 or D4 and both codes will let you buy a bag of pretzels. Now the mapping diagram would look like this: |
|
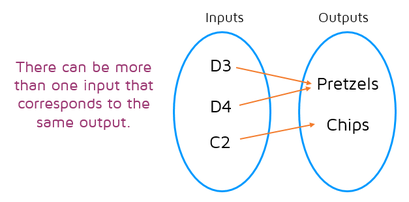
It's ok if you have a mapping diagram that has multiple arrows pointing to the same output value, it's still a function.
Here's what would NOT be a function. Let's say the mapping diagram looked like this:
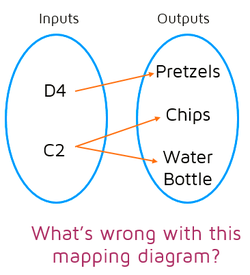
Can you figure out what's wrong with the mapping diagram above? There's an arrow drawn from D4 to pretzels. That means when you enter D4, you get a bag of pretzels. That's fine. There are two arrows drawn from C2 to chips and a water bottle. That means there's something wrong with the vending machine! If you enter the code C2, you should get the same thing out each time. The code you enter as the input value is supposed to give you the same output result. It doesn't make sense for the vending machine to give you chips one time you enter C2 and then the next time give you a water bottle.

The mapping below does NOT represent a function because the input C2 has been assigned to two different output values.
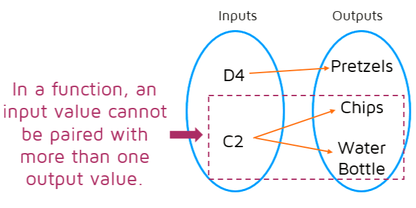
You will never have a function that has two arrows coming from the same input value. A function has to give only one output value for each input value. Think about functions as vending machines, if you enter the same code again, you should get the same thing out.
|
|
|