|

|
Graph with < Sign
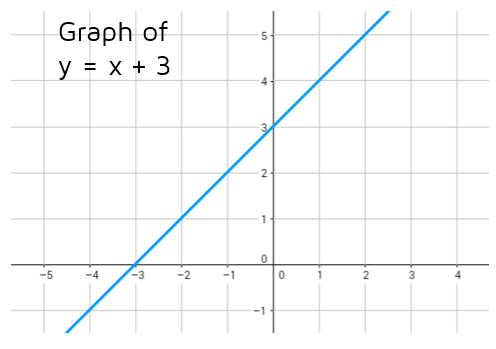
Let's look at what happens if we switch it to y < x + 3. If we pick the point (1,4) again and plug it into the inequality, we get 4 < 1 + 3. Is 4 < 4? Yes. 4 is less than or equal to itself, so the point (1,4) is still a solution. If we pick (2,5) we get 5 < 2 + 3. Is 5 less than or equal to itself? Yes. The points that lie on the line are solutions to the inequality. But the points on the line aren't the only ones that work!
Let's pick a point that's below the line, say (1,2). If we plug in the x- and y-values into the inequality, we get 2 < 1 + 3. Is 2 < 4? Yes, 2 is less than or equal to 4. You can try this with any point that's below the line and it will work in the inequality. This means the graph of the inequality y < x + 3 includes the points ON the line and BELOW the line. We can show this by shading all the points below the line.
Let's pick a point that's below the line, say (1,2). If we plug in the x- and y-values into the inequality, we get 2 < 1 + 3. Is 2 < 4? Yes, 2 is less than or equal to 4. You can try this with any point that's below the line and it will work in the inequality. This means the graph of the inequality y < x + 3 includes the points ON the line and BELOW the line. We can show this by shading all the points below the line.
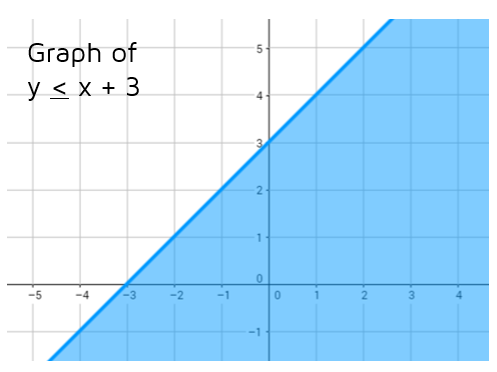
The graph above is called a half plane. The line y = x + 3 is called a boundary line and it has split the coordinate plane in half.
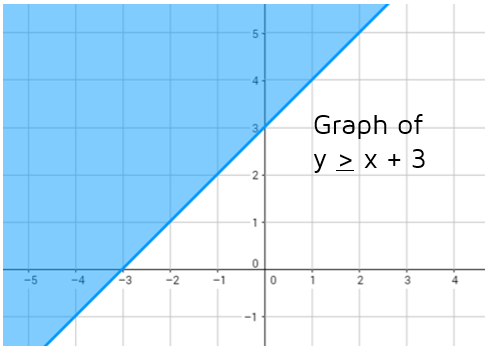
Graph with > Sign
Now let's look at the graph of y > x + 3. What happens when we switch the sign to greater than or equal to? How does the graph change? The points ON the line are still solutions, but now it will be the points ABOVE the line that work. For example, the point (1,5) is above the line. If we plug in 1 for x and 5 for y in the inequality, we get 5 > 1 + 3. Is 5 greater than or equal to 4? Yes. You can pick any point above the line and it will work in the inequality. We can show this by graphing the line y = x + 3 and then shading all the points above the line.
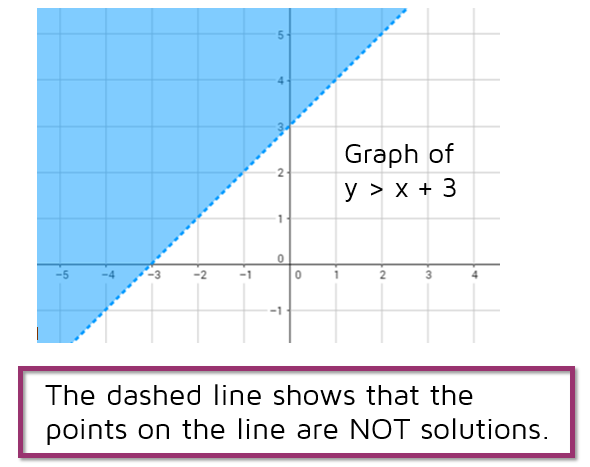
Graph with > Sign
Does anything change if we change it to just greater than (and not equal to)? What will the graph of y > x + 3 look like? The points ABOVE the line still work. (1,5) is above the line and 5 > 1 + 3. But what about the points on the line? (1,4) is on the line. Is 4 > 1 + 3? No, 4 is not greater than itself. The points on the line are not solutions.
How do we show this on the graph? We use a DASHED line to show that the line y = x + 3 is the boundary line between the points that work and the points that don't.
How do we show this on the graph? We use a DASHED line to show that the line y = x + 3 is the boundary line between the points that work and the points that don't.
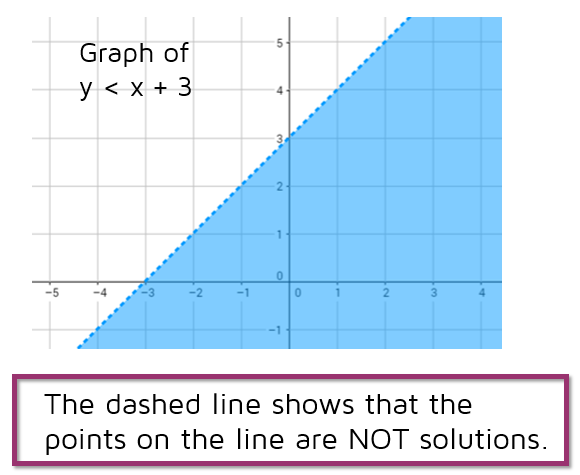
Graph with < Sign
Last one! What happens if we switch the sign from > to <? This gives us y < x + 3. Now any point BELOW the graph is a solution. For example, the point (0,0) is below the line. Is 0 < 0 + 3? Yes, 0 is less than 3. Do the points on the line work? (1,4) is on the line. Is 4 < 1 + 3? No, 4 is not less than itself. To show that the points on the line are not solutions, we use a DASHED line.
Steps to Graphing a Linear Inequality
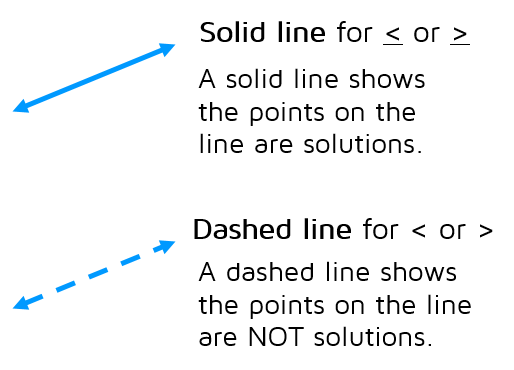
Step 1: Graph the boundary line. Use a solid line for < or > to show that the points on the line are included. Use a dashed line for < or > to show that the points on the line are not included.
Note: If your inequality isn't in slope-intercept form, you can rearrange it. Try to get the y by itself on the left side and make sure to switch the sign if you multiply or divide both sides by a negative number.
Note: If your inequality isn't in slope-intercept form, you can rearrange it. Try to get the y by itself on the left side and make sure to switch the sign if you multiply or divide both sides by a negative number.
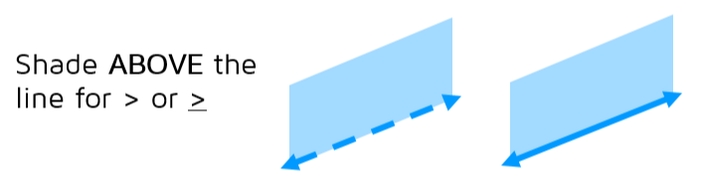
Step 2: Shade one side of the line to show the solution area.
Shade above the line for greater than, or greater than or equal to.
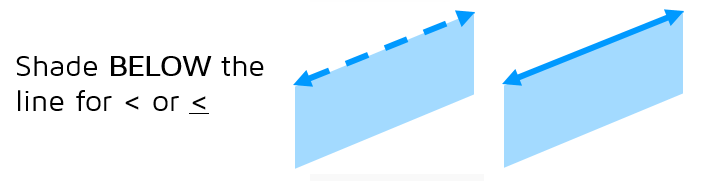
Shade below the line for less than, or less than or equal to.
If the line is a vertical line, you will need to try a test point to decide if you need to shade to the left or right.
Example 1
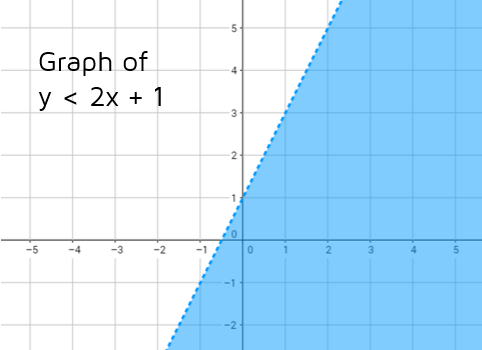
Graph y < 2x + 1
Step 1: Graph the boundary line. This line has a y-intercept of 1 and a slope of 2. (Click here for help with this step.) We need to use a dashed line to show that the points on the line are not solutions.
Step 2: Shade below the line. We have a less than sign, so we need to shade the area below the line. This shows that any point that lies below the line y = 2x + 1 is a solution to the inequality.
If you are ever not sure which side to shade, you can always pick a test point to try out. (0,0) is an easy one to try. If we plug in 0 for x and y, we get 0 < 2(0) + 1 which simplifies to 0 < 1. Is 0 less than 1? Yes. Any point you choose that's below the line y = 2x + 1 will work as a solution to the inequality y < 2x + 1.
Example 2
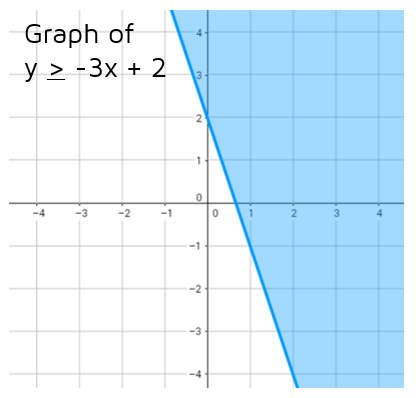
Graph y > -3x + 2
Step 1:Graph the boundary line. This line has a slope of -3 and a y-intercept of 2. We need to use a solid line to show that the points on the line are solutions.
Step 2: Shade above the line. The inequality is greater than or equal to, so we need to shade above the line. This shows that any point above the line is also a solution to the inequality.
Example 3
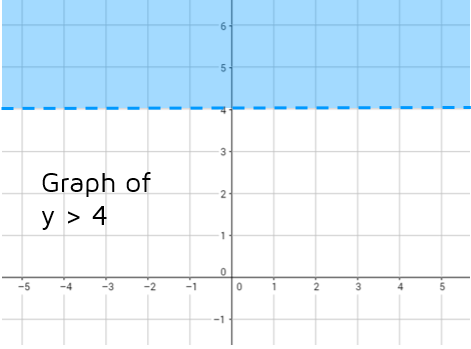
Graph y > 4
Step 1: Graph the boundary line. Did you notice that this inequality only has one variable? There is no x-term, so we could rewrite this as y > 0x + 4. The slope is 0 (it's a horizontal line) and the y-intercept is 4. We need to use a dashed line to show that the points on the line are not solutions.
Step 2: Shade above the line. We have a greater than sign, so the points above the line will be solutions to the inequality. All of the points above the line have a y-coordinate that is greater than 4.
Example 4
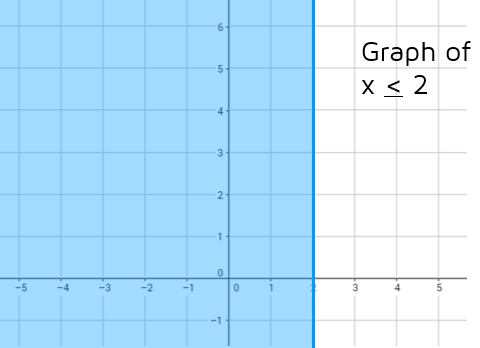
Graph x < 2
Step 1: Graph the boundary line. This inequality is missing a y-value so we can't write it in slope-intercept form. The graph of x = 2 is a vertical line that crosses the x-axis at (2,0). Every point on this vertical line has an x-value of 2: (2,1), (2,2), (2,3), (2,4), etc. Any time a linear equation is x = a number (and no y-term), the graph will be a vertical line. We need to use a solid line to show that the points on the line are solutions.
Step 2: With a vertical line, we can't shade above or below. But we can choose a test point on one side to try out. (0,0) is usually easy to try. In this case, we only have to plug in the x-coordinate of the point we chose. Is 0 < 2? Yes, so we need to shade the side that has the point (0,0) on it: to the left of the line. The points in this area of the graph have x-coordinates that are less than or equal to 2.
Practice
Ready to try a few problems on your own? Click the START button below to try a practice quiz.
|
Powered by |